SPIE BiOS Expo
January 25th ~ 26th, 2025
The Moscone Center
San Francisco, CA USA
Booth# 8337
Click here for more info

It is often heard that the cause of malfunctions of semiconductor laser products were the non-lighting of lasers. In addition, you must have the experience to face with many unfamiliar technical terms upon contact of laser manufacturers. The lifetime and reliability of semiconductor lasers are important characteristics for users and often described with terminology such as Weibull distribution, MTTF, Screening and so on, however, which is difficult to understand intuitively. This article explains the background and the meaning of them.
The time transition of the failure rate upon use of the products is shown in Fig.1. It is called “Bath-tub curve” because of its shape.
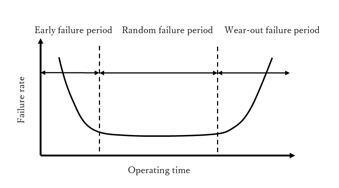
Fig.1 Bath-tub curve
The failure rate of products is not constant over time and is classified into the following three periods.
Early failure period: At the beginning stage of introduction of products, failures occur due to defective parts or improper adjustment, but the failure rate decreases over time through replacement or correction.
Random failure period: It is stage with almost no initial failures. However, random failure will keep the failure rate to remain constant.
Wear-out failure period: A long period of use causes products to degrade and fail more frequently with time.
This sequence of failure rate can be seen not only in semiconductor lasers but also in a wide variety of fields. In any field, it is preferable to use the products whose stage are stable and initial defects have been removed, that is Random failure period, not Early failure period nor Wear-out failure period.
Semiconductor laser manufacturers need to ensure that the initial defects of their lasers are sufficiently eliminated. The Weibull distribution is used in this confirmation process. The Weibull distribution is a probability distribution suitable for describing the 3 periods of bath-tub curve. By using this distribution, semiconductor laser manufacturers can know in which failure period their lasers are. The Weibull distribution is expressed mathematically as follows.
Probability density function:Probability of failure at time t without failure until time t
\begin{equation} f(t)=\frac{m t^{m-1}}{\eta^{m}} \cdot e^{-\left(\frac{t}{η}\right)^{m}} \end{equation}Failure rate:Probability of failure at time t
\begin{equation} \lambda(\mathrm{t})=\frac{m t^{m-1}}{\eta^{m}} \end{equation}Reliability function:Probability of no failure until time t
\begin{equation} R(t)=e^{-\left(\frac{t}{η}\right)^{m}} \end{equation}Cumulative failure rate:Probability of failure by time t
\begin{equation} F(t)=1-R(t)=1-e^{-\left(\frac{t}{η}\right)^{m}} \end{equation}m:Shape parameter. This parameter represents the shape of Weibull distribution and is also called Weibull coefficient.
η:Scale parameter. This parameter stipulates the time scale of Weibull distribution.
Semiconductor laser manufacturers perform their own life test, commonly called aging test, and plot this result as cumulative failure rate F (t) on Weibull chart. The aging test is performed in the order of 1000 hours at the maximum guaranteed temperature in general, and each aging curve is extrapolated to estimate failure time. The plot of failure cumulative failure rate F (t) on Weibull chart enables to estimate the Shape parameter and Scale parameter. Both parameters describe the information on the reliability of semiconductor lasers. Please refer to the following procedure for more details.
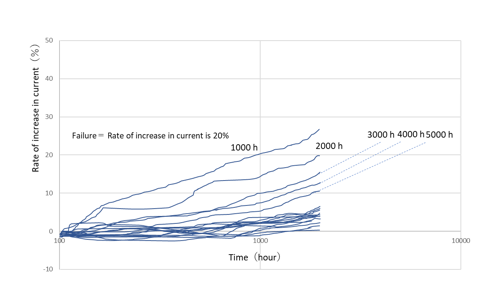
Fig.2 Aging curve
Fig.2 is an example of aging curves with N = 30 and 2000h. The vertical axis is the rate of increase in the operating current of semiconductor lasers. In general, a failure is defined as a certain rate of increase, where 20% is defined. Five units are in failure at 1000,2000,3000,4000 and 5000h. (The curves 3000,4000 and 5000h are extrapolated.) Fig.3 is the plot of this result on Weibull chart.
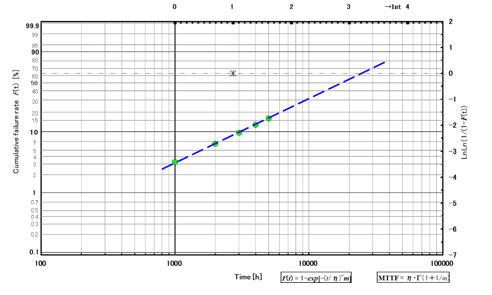
Fig.3 Plot on Weibull chart
The next step is to introduce “Shape parameter” and “Scale parameter”.
Shape parameter:
The right side of vertical axis in Weibull chart is described below from the formula above
\begin{equation} \ln \ln \{1 /[1-F(t)]\}=\operatorname{m} \ln (t)-\operatorname{mln}(\eta) \end{equation}The upper axis of Weibull chart is ln (t).
With new parameters below
\begin{equation} X=\ln (t), \quad Y=\ln \ln \{1 /[1-F(t)]\}, \quad b=\operatorname{mln}(\eta) \end{equation}as a result
\begin{equation} Y=m X+b \end{equation}can be obtained.
Therefore, the shape parameter m can be estimated from the slope of the plotted F (t). Please refer to Fig.4 for more details.
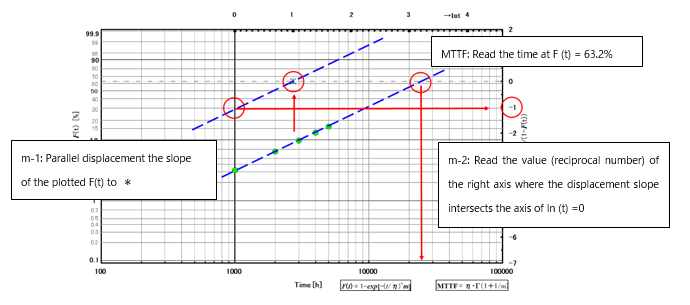
Fig.4 Usage of Weibull chart
m=1:The failure rate λ (t) is constant regardless of time t. If m = 1, the product is considered to belong to random failure period. In addition, at m = 1, the Weibull distribution is equivalent to an exponential function because the Weibull distribution is originally an extension of the exponential function.
\begin{equation} R(t)=e^{-\left(\frac{t}{\mathrm{η}}\right)} \end{equation} \begin{equation} \mathrm{F}(\mathrm{t})=1-\mathrm{R}(\mathrm{t})=1-e^{-\left(\frac{t}{\mathrm{η}}\right)} \end{equation}0<m<1:The failure rate λ (t) is a downward-sloping curve that gradually becomes gentle. At0<m<1, the product is considered to belong to early failure period.
1<m:The failure rate λ (t) is an upward-sloping curve that becomes sharp as the m value increases. At 1<m, the product is considered to belong to wear-out failure period.
Scale parameter:
In case of an exponential function with m = 1, 1 / η is called MTTF (Mean Time to Failure) which is an important index representing an exponential function. The cumulative failure rate in MTTF is
\begin{equation} \mathrm{F}(\mathrm{MTTF})=1-\mathrm{R}(\mathrm{MTTF})=1-e^{(-1)}=0.632 \end{equation}MTTF is the time to give 63.2% of cumulative failure rate and estimated from the plotted Weibull chart.
In this way, semiconductor laser manufacturers can estimate the failure period on the bath-tub curve and MTTF for their products by performing an aging test and plotting the result on Weibull chart.
Next, we will introduce a concrete example of the plotted Weibull chart.
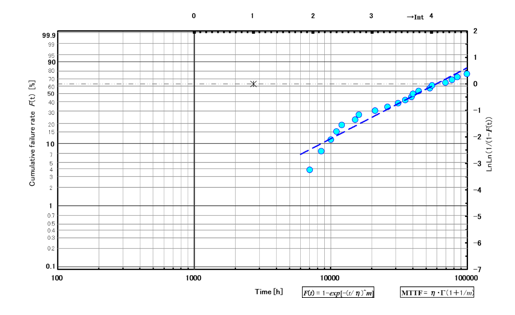
Fig.5 Weibull curve 1
Fig.5 is m = 1.05, MTTF = 60000h (N = 25). This semiconductor laser will belong to random failure period and the failure rate around 1000h is kept low enough.
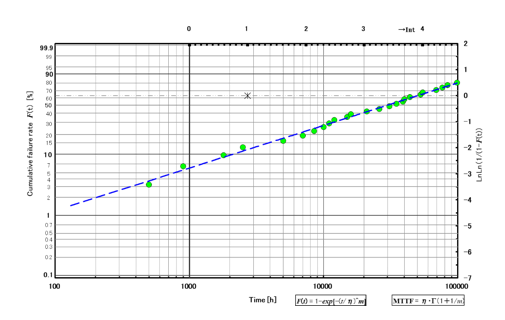
Fig.6 Weibull curve 2
Fig.6 is m = 0.75, MTTF = 50000h (N = 30). While MTTF differs by about 10000h compared to the previous case, the initial failure rate around 1000h has degraded rapidly. In this case, the laser manufacturers must consider that their products belong to early failure period because of the initial failure rate and m = 0.75, and then appropriate screening methods must be considered, as described next. Screening is a method to screen out initial failures in lasers. In general, the static laser characteristics such as operating current, threshold current, and slope efficiency in the optical output-current curve, are used for screening. In some cases, initial degradation rate in a short time aging is also used. If the screening method is not fixed yet, it is necessary to perform a long-term aging for samples with static characteristics and initial degradation rate in advance, and determine an effective screening methods. The screening of initial 5 defects results in improving the Weibull rapidly. See Fig.7.
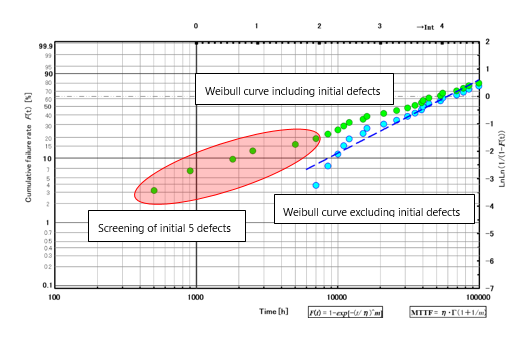
Fig.7 Weibull curve 3
In this way, the Weibull curve is effective and widely used to evaluate the lifetime and reliability of semiconductor lasers. Upon planning the use of semiconductor lasers, it is important to obtain not only the MTTF value but also the Weibull curve from laser manufacturers and check the comprehensive reliability of semiconductor lasers taking your requirements into account.
The Moscone Center
San Francisco, CA USA
Booth# 8337
Click here for more info
The Moscone Center
San Francisco, CA USA
Booth# 3337
Click here for more info