SPIE BiOS Expo
January 25th ~ 26th, 2025
The Moscone Center
San Francisco, CA USA
Booth# 8337
Click here for more info
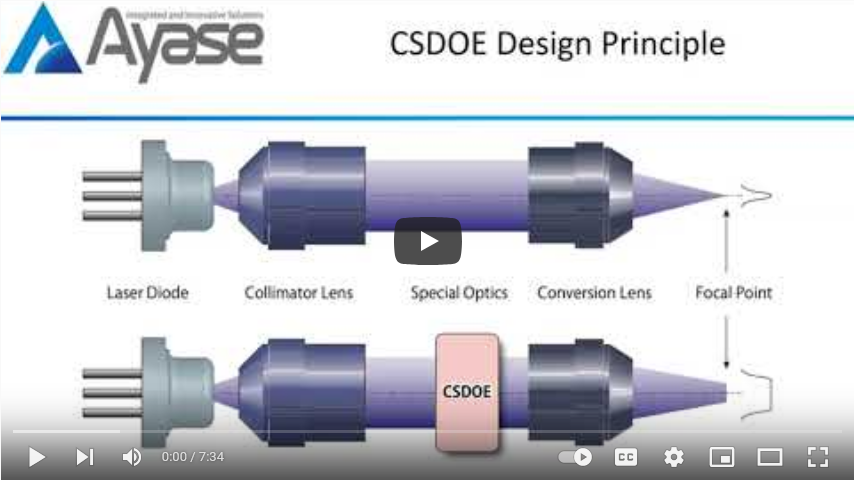
We, Ayase, provide laser light source modules. Our products are simple but consist of techniques such as
For your better understanding on our products, we will now summarize some of the optical technologies related to them.
Nowadays, there are many explanations or commentaries for beginners on the web. But if you want to go further, all you have to go on is university-level textbooks that are hard to get through and are often quite expensive.
In this article, we would like to summarize the level of discussion between a beginner’s explanation and university-level textbooks. Therefore, qualitative explanations using mere metaphors will be avoided as much as possible, and concrete explanations using mathematical formulas will be given.
A basic background in mathematics is inevitably necessary to do this. We won’t be doing the complicated calculations that you’d do in a science college class, but we will require basic knowledge of
We will present files written in Mathematica so that you can perform the transformation of the equation and check it with numerical values.
Mathematica is useful, but the software version is very expensive, so we don’t think many of you will be able to use it right away. However, all of the athematica code that we plan to give here will be executable enough to run on the Raspberry Pi OS bundled version or on Wolfram LanguageForJupter running on Jupyter notebook. We hope you will give it a try.
The human eyes are the light-sensing organs, and our sense of the outside world depends heavily on the information we receive from them. In the complete darkness, we cannot see what exists around us and can only grope with our hands. In order to see with the eyes, the object must be illuminated.
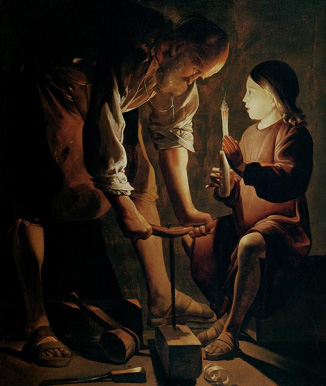
Figure 1: Georges de La Tour ”Saint Joseph”
In the famous painting ”Saint Joseph” by 17th century French painter Georges de la Tour, candlelight illuminates the faces of Joseph the carpenter and his child. The child is holding up his left hand to brighten his father’s tool. The light from the high flame of the candle is clearly drawn, while the areas far from the candle or in the shadows are so dark that it is difficult to tell what are depicted.
This is the technique of painting called tenebroso or chiaroscuro, where the emphasis light and dark invites viewers’ gaze to feel solidity of objects, and also gives them a sense of silence, intimacy, or drama. In the 17th century, there were no lights like today’s electricity, and it was usually for indoor spaces to be dimly lit even in the daytime, while the corners of rooms were completely dark at night.
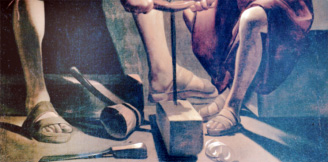
Figure 2: Lower part of ”Saint Joseph”
Light and darkness, in other words, intensity of light is often used as a means of expression in paintings, photography and film. Try brightening the dark areas of the previous La Tour painting with image processing software, as shown in Figure 2. You will see a flat picture of two people facing each other in a bleak room. In the original dark area, there are few tools which should be in a carpenter’s workshop, and the child is sitting on a vague square box. You can see that the father is trying to drill a hole in a squared lumber, but there are no markings on it, so you will wonder that he is trying to drill it at a guess. In other words, nothing is drawn in the dark area that should be there.
Dark areas are not clearly visible to the human eye, and this has the effect of arousing the imagination, which is why paintings and photographs use them for dramatic purposes.
In general, human eyes get easily tired in bright and dark environments, and in particular, glare in bright areas makes it difficult to see. Compare Figure-1 and Figure-2 again. You can see that averaging the light and dark areas makes it comfortable on the eyes (although it makes the picture more boring).

Figure 3: Desirable Lighting
Also, in the earlier painting of La Tour, the child is holding his left hand over the flame. One of the purposes of this is to reflect the candlelight in the palm of Joseph to gather more light into his hand. The other is that the light from a small flame will cast a dark shadow. In other words, the difference between bright and dark areas becomes large, so the light from a small flame acts as a pseudo-light source spread over the area of the palm of the hand to prevent extreme brightness and darkness from occurring.
If it were more for Joseph’s sake, the child should have used a white board or paper instead of his palm. In addition, a thin paper diffuser should be placed on Joseph’s side of the flame to spread the light to make his work easier. In other words, it should look like Figure-3. In fact, some candlestands were covered with a tube made of thin paper or frosted glass, which also served as a windbreak.
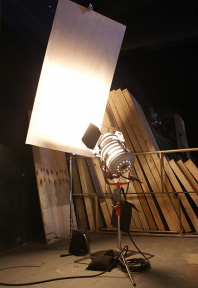
Figure 4: Board reflector (from Wikipedia)
Human sight is able to adjust the sensitivity of photoreceptor cells and the size of the pupil to cope with more or less light. However, it is not possible to adjust the sensitivity of specific photoreceptor cells in certain parts of the retina. In other words, the adjustment mechanism may be useless when there are bright and dark areas in the same visual field.
As is mentioned above, a scene with strong light and dark in the field of view tends to tire the eyes and make it difficult to see things in the dark, so if the goal is not to create a pictorial effect, it is desirable to have light reaching the scene as evenly and uniformly as possible.
Various methods have now been designed for uniform lighting. For example, you may have seen the reflectors shown in Figure 4. The board reflector diffuses the incident light. A transmissive type is used for example in the window of an electronic flashlight source attached to the hot shoe of a single-lens reflex camera.
Diffusers basically spread the incident light in various directions, as shown in Figure
5. No matter what the profile of the intensity distribution of the incident light flux is, after it passes through a diffuser, the intensity distribution will become uniform in front of the diffuser.
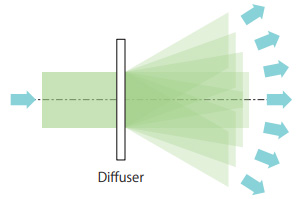
Figure 5: Function of a diffuser
We will do a numerical experiment to confirm the uniformity due to the function of a diffuser.
Suppose that a window of a certain width is filled with light whose intensity is varying by normal distribution from place to place. This is an extreme example, and it is not possible for the light intensity at one location to be uncorrelated with its neighbors, but just for simplicity.
When the light passes through the diffuser, the intensity distributions are shifted and overlapped as shown in Figure 6.
Figure-7 shows the calculation of what happens when a number of these overlap.
The small box on the left in the figure shows intensity profile for given number of times shifted horizontally and added together, and the figure on the right shows them drawn on the same figure simultaneously. The trapezoidal shape reduces the length of the top edge, but in return, the jagged noise decreases and the shape becomes flatter.

Figure 7: Result of the numerical experiment
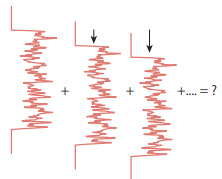
Figure 6: Numerical experiments
In general, there is an intensity noise with normal distribution at each of N locations, and let the approximate magnitude of the noise be expressed in RMS, i.e.,
\begin{equation} \mathrm{RMS}=\sqrt{\frac{1}{N} \sum_{i}^{N}\left(x_{i}-\bar{x}\right)^{2}} \end{equation}(1) Where, x¯ is the average value of xi. When this is shifted and superimposed M times, the noise magnitude RMSM can be said
\begin{equation} \mathrm{RMS}_{M} \approx \frac{1}{\sqrt{M}} \end{equation}Light pipe(from Edmund site)Fly-eye lens
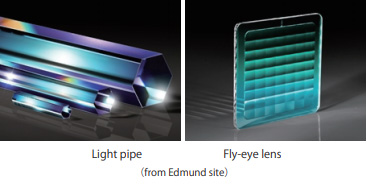
Figure 8: Example of an element that homogenizes the light intensity distribution
(2) In other words, the more shifted and superimposed intensities is, the smaller the noise becomes (the proof is omitted because this is not the purpose here.).
Thus, a diffuser has the function of equalizing the intensity distribution. In the past, they were just frosted glass and the only parameter was roughness, but recently, microfabrication technology has made it possible to specify various parameters, such as controlling the diffusion direction or angle.
There are also elements such as light pipes and fly-eye lenses as shown in Figure-8. These are used for different purposes than diffusers, but the basic principle is the same as that of the diffusers shown above, and they are used to equalize the intensity distribution of light.
Light from lamps and LEDs can be diffused with diffusers or other optical elements to equalize the intensity distribution of the light. On the other hand, coherent light such as laser light, unlike lamp light, produces large noises called speckle when passed through a diffuser.
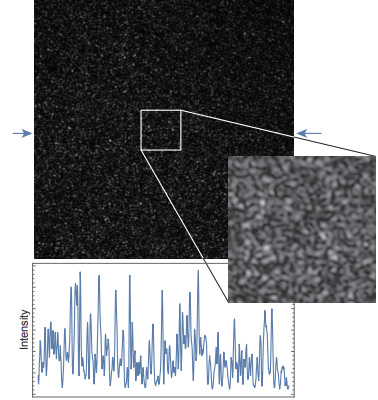
Figure 9: Example of speckle
Figure-9 shows the intensity distribution when the light from a semiconductor laser is reflected on a diffuser and the graph below shows the intensity profile on the straight line indicated by the arrow. As you can see, fine grainy noise appears (we’ll mention about this elsewhere). When light is reflected by a rough surface such as a diffuser, light with different optical path length reaches the same position as shown in Figure- 10. This phenomenon causes light intensity uniform for ordinary light, but in lasers, due to the high coherency, interference occurs, causing intensity fluctuation.
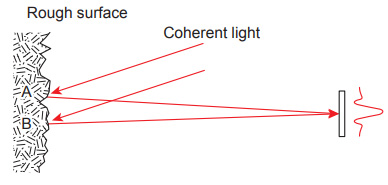
Figure 10: Occurrence of speckle
This can not be called uniform lighting.
That is to say lamp or LED light can be homogenized by superimposing the intensity distribution of the light, but if the same thing is done with laser light, the noise will increase on the contrary and therefore the superimposing technique cannot be used.
However, speckle is the result of interference, so if no interference occurs, no speckle is generated. In order to prevent interference, It can be thought that light with different optical path lengths should not reach the same point. And it is necessary to devise another way to achieve uniform intensity distribution.
See the lens shown in Figure-11.
This is a so-called afocal lens, which is a lens with infinite focal length that receives parallel light from the left and emits parallel light from the right. In the figure, thin black lines represent the loci of rays calculated by a method called ray tracing (we will explain about it here in the future). You can see that each ray does not intersect, and therefore, even if we put this lens in the laser flux (if there is no speckle before we put it in, then by putting it in), there will be no speckle.
And there are also a vertical arrows on the left side, which represent the width of four rays. On the left side before entering the lens, the arrows are all the same length, but after passing through the lens, the length of the arrows are different: longer in the center and shorter toward the edges. In other words, the lens is designed in such a way that the ray density changes before and after the lens.
As an extreme analogy, let’s say that one ray of light corresponds to one photon (particle of light). The intensity of the light is proportional to the number of photons. The intensity of light per unit area is proportional to the number of photons arriving there. If the ray density changes, it means that the light intensity per unit area changes.
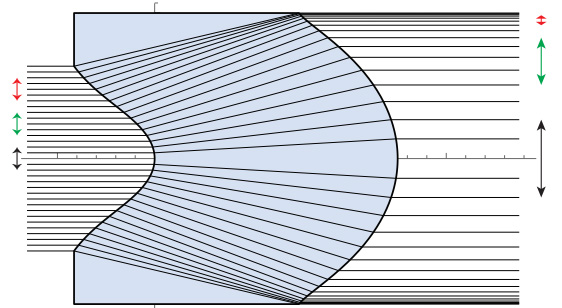
Figure 11: Afocal lens
Before explaining the function of the lens in Figure-11, we will take a short detour.
There are various properties of light source. Spectral intensity (spectrophotometry) and energy efficiency are always required. Other important properties are the emitting area (and its shape) and angular distribution. For example, in a light bulb, the filament is the light emitting element, so the shape is very complex, but the filament itself emits light with the same intensity 360 °(strictly speaking, 4πsr(steradian)) in any direction.
An emitter shape of LED is usually square flat and light is emitted from the front of them, but not from the back. Also, there is more light in the vertical direction of the plane, and less in grazing angle. These are roughly determined by its light emitting principle.
A laser, on the other hand, has a much smaller emitting area compared to the size of its lasing medium. The emitted light appears to come from a single small point. Also, the angular distribution is much narrower than that of LEDs, and the light is emitted without diverging. Due to these properties, such as very small emitting area and small divergence angle, if you look directly into the laser beam with your eyes, the emitting point will be imaged on the retina by the crystalline lens, and almost all of the light coming out of the laser will be converged on the retina, which may burn the retina.
Also, many lasers have a specific angular distribution. This is because it is one of the conditions for the emitting efficiency, and is determined for the laser design. Let the intensity of light emitted be I(θ) in the direction of a certain angle θrad, I(θ) is in the form of a Gaussian, i.e.,
\begin{equation} I(\theta) \propto e^{-2\left(\frac{\theta}{a}\right)^{2}} \end{equation}(3) Where, α is a constant for the magnitude of the divergence, which means that the intensity in the direction of θ = α will be 1/e 2 (≈13%) of the intensity ratio to the direction of θ = 0. The value of α is almost fixed for each laser, for example α ≈ 0.5mrad for low power He-Ne lasers and α ≈ 0.1 ∼ 0.5rad (≈ 8 ∼ 40 °) for semiconductor lasers. A typical form is shown in Figure-12.
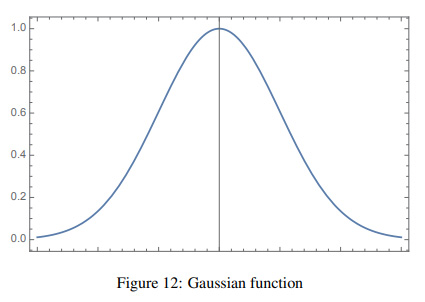
As you can see, the divergence angle varies from laser to laser, but the angular distribution of almost all of them (especially for low power lasers) has a Gaussian shape, namely the light is stronger in the center and weaker as it moves outward.
If we input the Gaussian intensity distribution into the lens of Figure-11, it can be expected that it will be converted into a uniform intensity distribution.
Such a conversion to a uniform intensity distribution is called a Tophat conversion. A tophat is a formal hat for men, a so-called silk hat. This is because the top of this hat is flat and the profile of the uniform intensity distribution is similar to the shape of this hat seen from the side. This lens can make Gaussian distribution uniform without speckle.
But of course, the change in ray density due to the lens must be just the opposite of the Gaussian shape. Also, the incident light must be collimated, not a diverging beam.
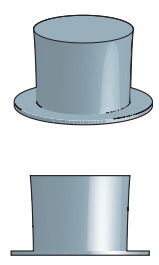
Figure 13: Tophat
Let’s consider how the rays of light should change before and after the conversion element to make the Gaussian shape tophat. For simplicity’s sake, let’s consider the case where the ray is tophat only in one direction, while the direction perpendicular to it remains unchanged. We will consider how the rays should be converted, regardless of what surface shape of the conversion element will be. Also, let’s assume geometrical optics without considering diffraction and the element is line symmetric about the optical axis.
Assuming parallel light incidence (we will leave aside for now how to make the light parallel), the intensity distribution at the incident side is expressed by the distance (height) from the center (optical axis). The intensity at that position is Ii(h) for the distance h from the optical axis at the incident side. That is,
\begin{equation} I_{i}(h)=e^{-2\left(\frac{h}{n_{0}}\right)^{2}} \end{equation}(4) where h0 is the height at which the intensity is ratio 1/e
2 to that on the optical axis.
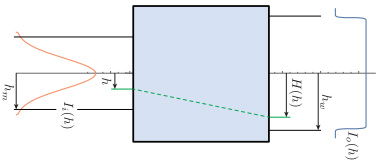
Figure 14: Conversion of ray density
The intensity of the Gaussian rapidly decreases apart from the optical axis (h is large), but it does not go to zero. So we will convert up to a certain height hm into a tophat shape, and discard the rest. Let hw be the height of the edge of the top hat. Therefore, we can say that the ray of hm will be hw when it leaves.
Suppose a ray of height h at the incident side has height H(h) at the output side, as shown in Figure-14. Of course,
\begin{equation} \begin{array}{r} H(0)=0 \\ H\left(h_{m}\right)=h_{w} \end{array} \end{equation}And let Io(h) be the intensity at the height h of the output side. The small length dh in the height direction at the height h on the output side is
\begin{equation} d h^{\prime}=\frac{d H(h)}{d h} d h \end{equation}(5) And assuming that there is no loss inside the conversion device, all the intensity entering dh goes out to the output side.
\begin{equation} \begin{aligned} I_{i}(h) d h &=I_{o}(H(h)) d h^{\prime} \\ &=I_{o}(H(h)) \frac{d H(h)}{d h} d h \end{aligned} \end{equation}(6) thus the intensity should match on the incident side and the output side. Also, as the total intensity should match, then
\begin{equation} \begin{aligned} \int_{0}^{\sqrt{l_{m}}} d h I_{i}(h) &=\int_{0}^{\sqrt{l_{m}}} d h I_{o}(H(h)) \frac{d H(h)}{d h} \\ &=\int_{0}^{h_{w}} d h I_{o}(h) \end{aligned} \end{equation}(7) Here, the intensity distribution at the incident side is Gaussian, and we assume it is constant regardless of the height at the output side, let
\begin{equation} I_{o}(h)=\Upsilon_{0} \end{equation}(8) The equation-7 is
\begin{equation} \begin{aligned} \int_{0}^{h_{m}} d h e^{-2\left(h / h_{0}\right)^{2}} &=\int_{0}^{h_{w}} d h^{2}_{0} \\ &=\Upsilon_{0} h_{w} \end{aligned} \end{equation}(9) therefore,
\begin{equation} \Upsilon_{0}=\frac{h_{0}}{h_{w}} \sqrt{\frac{\pi}{8}} \operatorname{erf}\left(\sqrt{2} \frac{h_{m}}{h_{0}}\right) \end{equation}(10) where erf(z) is called the error function and its definition is
\begin{equation} \operatorname{erf}(z) \equiv \frac{2}{\sqrt{\pi}} \int_{0}^{z} d t e^{-t^{2}} \end{equation}This integral cannot be expressed in terms of elementary functions. The equation-6 is
\begin{equation} \begin{aligned} e^{-2\left(h / h_{0}\right)^{2}} d h &=\Upsilon_{0} \frac{d H(h)}{d h} d h \\ \frac{d H(h)}{d h} &=\frac{e^{-2\left(h / h_{0}\right)^{2}}}{\Upsilon_{0}} \end{aligned} \end{equation}(11) so, the function H(h) will be fixed as
\begin{equation} \begin{aligned} H(h) &=\frac{h_{0}}{\Upsilon_{0}} \sqrt{\frac{\pi}{8}} \operatorname{erf}\left(\sqrt{2} \frac{h}{h_{0}}\right) \\ &=h_{w} \frac{\operatorname{erf}\left(\sqrt{2} \frac{h}{h_{0}}\right)}{\operatorname{erf}\left(\sqrt{2} \frac{h_{m}}{h_{0}}\right)} \end{aligned} \end{equation}(12) The error function shape is shown in Figure-15
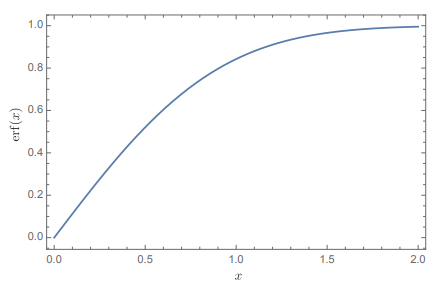
Figure 15: error function
For example, for the case of h0 = 1、hm = 1、hw = 1.5 rays are drawn in Figure-16. Shape of the surface had to be for the rays in Figure-11. In order to achieve this rays on two surfaces, both sides must be aspherical. The surface shapes can be determined by optimization calculations using general-purpose lens design software such as Zemax, CodeV, etc. Also, under certain conditions, it can be determined by numerical integration instead of optimization. However, we will not perform the calculation because it would involve very large expression.
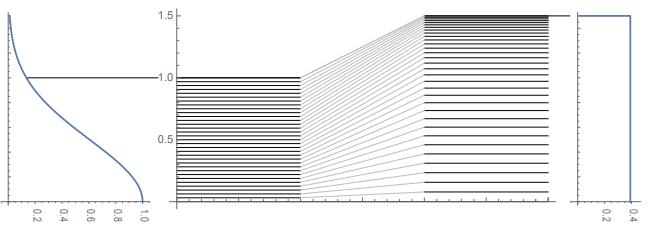
Figure 16: Example of tracing rays
In the previous section, we showed an afocal example. However, this does not illuminate an area wider than the diameter of the lens. It would be better to have a smaller lens and a wider illumination area.
It’s easy to see how to achieve this. That is to say we can fan out the rays and extend the illumination area as shown in Figure-17.
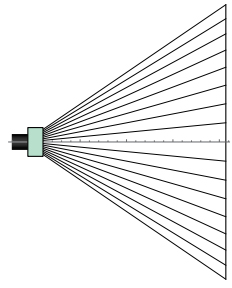
Figure 17: Expand illumination area
There is one thing to keep in mind here. With the afocal lens, all rays enter the plane of the illuminated object perpendicularly. However, with an optical system like the one shown in this figure, the angle of incidence of the rays differs depending on the location. How should we think about the light intensity in such a case?
Consider the case where a beam enters a window with width d while diverging, as shown in Figure-18. Suppose that the beam enters the window at a tilt of θ relative to the window normal.
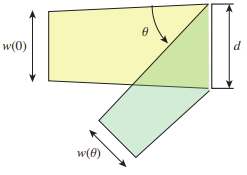
Figure 18: Incident light through a window
Let w(θ) be the width of the rays that can pass through the window, then
\begin{equation} w(\theta)=d \cos \theta \end{equation}(13) In other words, the rays at certain angle to the window will reduce the amount of rays that passing through the window. Conversely, rays of the same width can illuminate a wider area if it is slanted, which in turn reduces the amount of rays per unit area.
In the terms of illumination technology, the amount of light flux that enters per unit area of an object surface is called illuminance. It is an amount that takes into account the fact that a light flux of the same intensity will reduce the amount of light flux if it enters the surface to be illuminated at certain angle, that is, it will be darker.
Strictly speaking, the definition of illuminance is not a physical quantity, but a sensory quantity corrected for the spectral sensitivity of the eye, but there is no need to worry about it if it is a single wavelength and absolute value is not significant.
In order to achieve ”uniform illumination” in an optical system such as Figure-17, the effect of this oblique incidence must be taken into account, and the uniformity must be evaluated in terms of ”illuminance” rather than ”light intensity”.
Furthermore, it is intuitive that the distance from the light source also has an effect on the light flux, which is not collimated but diverging as it travels.
4.1 Formulation with uniform illumination
In the afocal example of the previous section, there is no problem even if the ”intensity” and ”illuminance” are ambiguous because all rays enter the plane at the same angle when illumi-nated on a flat surface, but in Fig. 17, we need to consider the angle at which each ray enters the plane. Let’s consider a transformation to make the ”illuminance” uniform in this case.
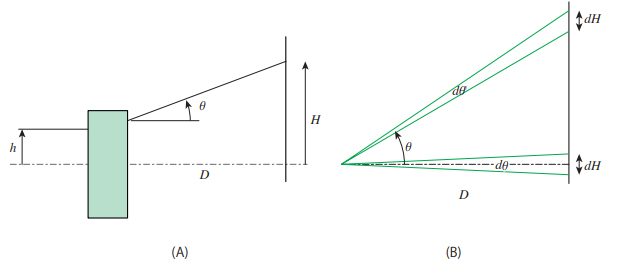
Figure 19: Uniform illumination with diverging flux of rays
As in the afocal case, suppose a ray of light enters the element parallel to the optical axis at a height of h, passes through the element, and exits at an angle θ to illuminate a plane perpendicular to the optical axis at a distance of D from the element, as shown in Figure 19(A). The element is assumed one-dimensional, therefore it has no effect in the direction perpendicular to the plane shown as in the figure.
Also, for simplicity’s sake, assuming
\begin{equation} h \ll D, H \end{equation}namely the distance from the element to the illumination surface is far enough to be considered as H − h ≈ H, which means that the size of the element is ignored compared to the illumination area. As in Figure-19(B) it is assumed as
\begin{equation} H=D \tan \theta \end{equation}(14) Based on this assumption, we can consider what shape θ(h) should be to make it uniform across the illumination surface. Considering how the small height dh at the incident side corresponds to dH at the illumination plane,
\begin{equation} \begin{aligned} d h &=\frac{d h}{d \theta} d \theta \\ &=\frac{d h}{d \theta} \frac{d \theta}{d H} d H \end{aligned} \end{equation}dH then from equation-14(assuming 0 ≤ θ < π/2) it leads
\begin{equation} d h=\frac{d h}{d \theta} \frac{\cos ^{2} \theta}{D} d H \end{equation}One order of the cos2 can be interpreted as the coefficient due to the diagonal entry explained in the previous section, and the other as the coefficient for the distance to dH, which is also farther by D/ cos θ (Remember that this is in one dimension).
Since the amount of light entering dh is Ii(h)dh, then
\begin{equation} I_{i}(h) d h=I_{i}(h) \frac{d h}{d \theta} \frac{\cos ^{2} \theta}{D} d H \end{equation}We want Io(H)dH to be constant in the illumination plane, so we assume that the coefficient of dH is the constant Υ0.
\begin{equation} \Upsilon_{0}=I_{i}(h) \frac{d h}{d \theta} \frac{\cos ^{2} \theta}{D} \end{equation}(15) Since θ(h) is a single valued function, it can be
\begin{equation} \frac{d \theta}{d h}=1 / \frac{d h}{d \theta} \end{equation} equation-15 will be \begin{equation} \frac{d \theta}{d h}=\frac{I_{i}(h) \cos ^{2} \theta}{\Upsilon_{0} D} \end{equation}(16) We can consider this as a differential equation about θ(h) and solve it with Ii(h) as equation4, but it is quite difficult. Let the software perform the math, then
\begin{equation} \theta(h)=\tan ^{-1} \frac{h_{0} \sqrt{\pi / 2} \operatorname{erf}\left(\sqrt{2} \frac{h}{h_{0}}\right)}{2 D^{\Upsilon}_{0}} \end{equation}(17)The Υ0 can be determined, in the same way as in the afocal case, by integrating the amount of light up to it, assuming that the light ray up to the height hm is converted to the ray at the angle θw. We will not calculate it here because it must also be a relatively large equation. As in the afocal case, the rays for α = 1, hm = 1, and θw = 45 °are shown in Figure-20. You can see that most of the higher rays are emitted in the 45 °direction, increasing the ray density.
This also requires aspheric surfaces to be realized in an actual optical element.
The principles above are the basis for the design and evaluation of our product, Lineman. We would like to emphasize that the distinction between intensity and illuminance is not always clearly defined in the specifications of other companies’ products, but our products are designed and evaluated according to this strict definition.
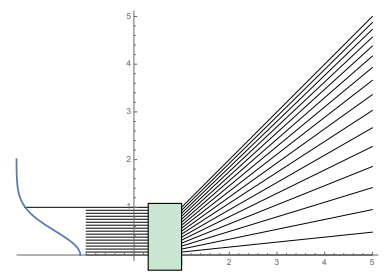
Figure 20: Calculation example
In our site here, we want to cover the topics of principles and optical issues related to our products from now on. Please stay tuned
The Moscone Center
San Francisco, CA USA
Booth# 8337
Click here for more info
The Moscone Center
San Francisco, CA USA
Booth# 3337
Click here for more info